
Dow Theory
Dow theory, developed by Charles H. Dow in the late 19th century, is a foundational framework for technical analysis in financial markets. It comprises of six basic tenets, summarized below alongside some examples of their application.
Tenet 1: The Market Discounts Everything
The first tenet of Dow Theory is that all available information is reflected in market prices — everything is priced in.
This includes economic information (like interest rates, probability of interest rate changes, GDP growth, unemployment rates, corporate earnings, revenue forecasts, etc.), political information (like election probabilities, changes in tax policy, regulatory changes, geopolitical conflicts, trade wars, etc.), and psychological information (like hype cycles, herd behaviour, fears during sell-offs, optimism during rallies, etc.).
As new information becomes available, it is incorporated into market prices which adjust accordingly.
As an example, consider a biotechnology or pharmaceutical start-up whose existence hinges on the development of a new drug. During phase II clinical trials, the company’s stock price will reflect its probability of success in this crucial step (typically 30% to 40%). When trial results are announced, it will be a binary event that resolves this uncertainty to either 0% or 100%, causing a sharp decrease or increase in the company’s valuation as the market prices in the new information.
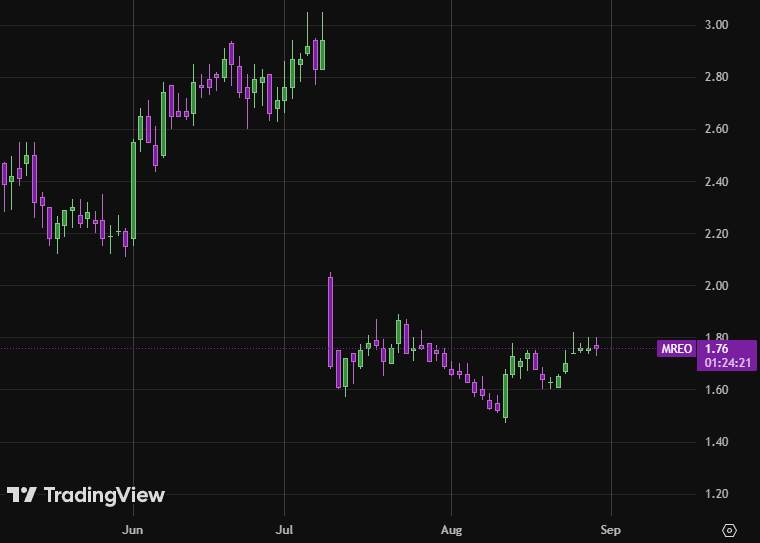 Example of failed clinical trial
Tenet 2: The Market Has Three Movements
The second tenet is that the market has three movements, or trends, that are prevalent on different timeframes.
The main movement, aka primary trend, is the overall market direction when viewed on longer timeframes, such as from half a year to several years. It can be bullish or bearish.
The medium swing, aka secondary trend, is a retracement of 33% to 66% of the price change since the previous medium swing or start of the main movement. It can be viewed on intermediate timeframes, such as from ten days to three months. Within a bullish primary trend, these pullbacks can be good opportunities to buy.
Short swings, or minor movements, are the intermittent fluctuations or market noise present on shorter timeframes.
The mechanics of the movements observed by Dow are embedded into chart patterns used in modern technical analysis. For example, a bullish flag depicts a pullback within a bullish primary trend.

With the advent of electronic trading systems and high-frequency trading, it has become possible to trade on much shorter timeframes than in Dow’s era. Active traders looking to take short trades can adapt the timeframes of this theory’s movements to the time horizons of their trades. For example, day traders might consider primary trends to take hours and secondary trends to take minutes, with anything shorter being noise. Swing traders might consider primary trends to take weeks and secondary trends to take days, with anything shorter being noise.
Tenet 3: Primary Trends Have Three Phases
The third tenet is that primary trends have the following three phases: accumulation, absorption (public participation), and distribution.
In the accumulation phase, savvy investors actively build positions against the general opinion of the market. On stock charts, accumulation for a bullish primary trend can be indicated by green candles with larger volumes than surrounding candles.
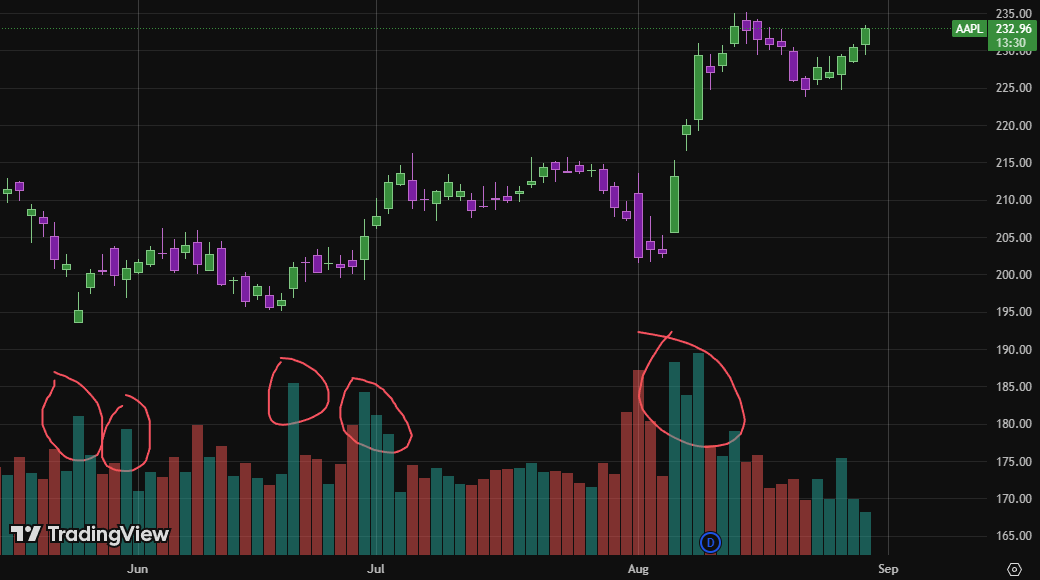 Examples of accumulation candles
In the absorption phase, the market eventually catches on to these astute investors and a period of large price change is experienced due to a sustained trend. It is fueled by the participation of trend followers and other technically oriented investors. Trend followers are market participants that join in upon noticing the trend, and include CTAs (Commodity Trading Advisors) as well as retail investors. This phase typically lasts the longest.
In the distribution phase, the primary trend has reached a point of rampant speculation. It is at this time that the astute investors begin to distribute their holdings to the market while others continue increasing their positions. On stock charts, distributions near the end of a bullish primary trend can be indicated by red candles with larger volumes than surrounding candles.
Tenet 4: Market Indices Must Confirm Each Other
In the 1900’s, the US was a growing industrial power. It had factories around the country that needed to ship goods to customers in population centers, usually via railway. Consequently, Dow observed that stock market averages for industrial companies and transportation companies needed to rise and fall in tandem. A bull market in industrials could not occur unless the railway average rallied as well, usually first.
The fourth tenet is that these two averages should be moving in the same direction to confirm each other. When their performances diverge, it is a warning sign that one of their prices has become detached from its fundamental value.
Dow’s averages still exist today, though featuring new additions to more accurately reflect the US’ modern economic landscape. In addition to industrials, the Dow Jones Industrial Average (DJIA; ticker $INDU) now also contains companies from other sectors, such as technology and financials. And the Dow Jones Transportation Average (DJTA; ticker $DJT or $TRAN) has expanded to include airline, trucking, and logistics companies in addition to its original railway focus. Upon comparing their recent performances, we can see that a large divergence has been forming since late 2024.
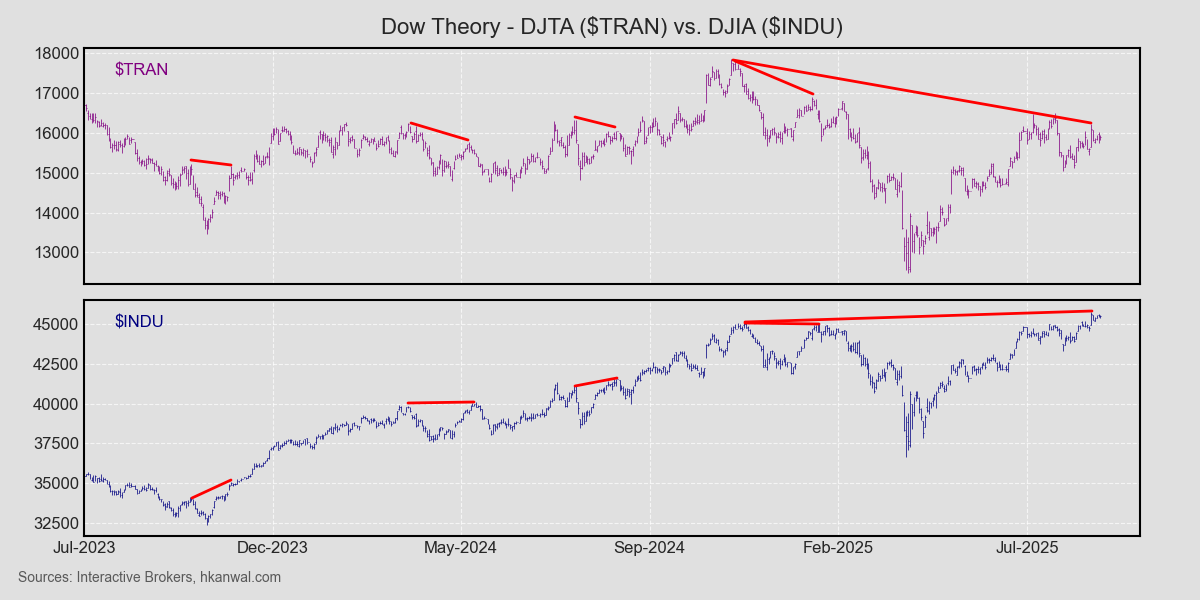 Recent divergences
It can be noticed that while the DJIA has making making higher highs, the DJTA has not been confirming the move, instead making lower highs. Discrepencies like these must eventually resolve themselves — either by the DJTA outperforming the DJIA to make a comeback, or by the DJIA suffering a significant correction.
Tenet 5: Trends Are Confirmed By Volume
The fifth tenet is that volume confirms price trends.
When a price movement is accompanied by high volume, its direction can be considered representative of the market’s expectation, therefore signalling that a trend is forming. To further confirm the market’s directional conviction, secondary movements against the primary trend should occur with lower volume.
For example, in reference to a bullish flag setup, the pullback, aka medium swing, should occur on lower volume to confirm the pattern.
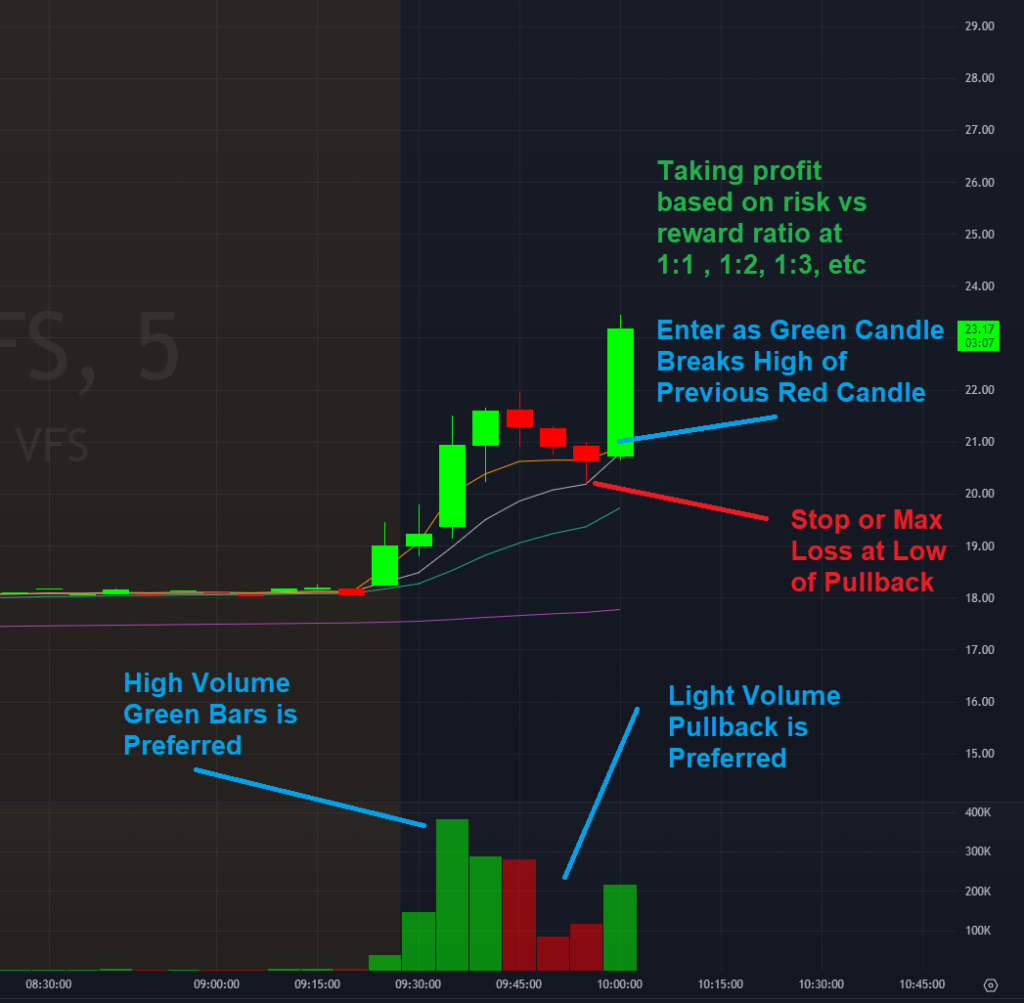 Day traders’ bullish flag with ideal volume
If selling volume were to increase during a pullback within a bullish primary trend, it could be a sign that market participants are turning bearish
Tenet 6: Trends Persist Until Definitive Signals Prove They Have Ended
The sixth and final tenet is that, though prices may temporarily move against the primary trend, they will soon resume their prior movement unless there is a definitive signal that a reversal has occurred.
Since it is difficult to differentiate between a secondary movement and a change in primary trend, the recognition of reversal signals is where Dow theorists often disagree. Given the myriad technical indicators used nowadays, the conditions necessary to qualify a movement as a reversal are often based on a trader’s personal strategy and experience.
Some examples of potential reversal signals include: moving average crossovers, reversal patterns such as the head and shoulders pattern, and breaks outside directional channels.
 Head and shoulders reversal pattern
Conclusion
Though it has been over a century since Dow Theory was developed, it remains foundational to modern technical analysis, and its tenets are still applicable and useful in the analysis of the financial markets of today.