
Gamma Flip Line
The gamma flip line is a leading indicator that can warn traders of potential market crashes by reliably predicting the periods of high volatility that accompany them. For instance, traders paying attention to it could have avoided the tariff induced crash of early 2025. To make use of its predictive capabilities, let’s derive our own using Python. In the process, we will learn what the gamma flip line represents and why it works.
Market Makers
When financial instruments are traded, there exists a gap between the bid price (the maximum price buyers are willing to pay) and the ask price (the minimum price sellers are willing to recieve). This gap is called the bid-ask spread.
Market makers are market participants that monetize this spread by simultaneously and continuously buying at the bid (quoting a bid price) and selling at the ask (quoting an ask price). They are liquidity providers that are always ready to take the opposite side of trades that cross the spread.
To avoid directional risk and ensure their returns are market neutral, market makers maintain an overall position that is delta neutral. They do so by hedging their option positions with a position in the underlying. As their option delta changes, to maintain a net delta that is continuously zero, their hedge is adjusted dynamically. The amount their option delta changes for each $1 change in the price of the underlying is called their net gamma.
Note: For indices, market makers are unable to hedge using the underlying directly. Instead, they use highly correlated instruments like ETFs, futures, and baskets of constituent stocks.
Market maker hedging behaviour varies drastically depending on the sign of their net gamma. When they have a positive net gamma, market makers act as a stabilizing force, decreasing volatility by buying when the underlying price goes down, and selling when it goes up. When they have a negative net gamma, however, they act as a destabilizing force, increasing volatility by selling when the underlying price goes down, and buying when it goes up.
By estimating market maker net gamma and identifying when it flips from positive to negative, traders can receive a warning signal for shifting market conditions and turbulent times ahead.
Estimating Net Gamma
Long options have positive gamma, and short options have negative gamma. Market maker net gamma is calculated as the sum of the gammas of their long and short options. Thus, the calculation requires these two pieces of information per option: positioning and gamma. For example, a position of 1 long option with a gamma of 0.1, plus a position of 2 long option with a gamma of 0.2, plus a position of 1 short option with a gamma of -0.05 would result in a net gamma of 0.45.
The total of an option’s outstanding contracts is called its open interest. Unfortunately, only open interest is publicly disclosed, and not how much of it market makers are short or long. Since we can not know exact market maker positioning, it is impossible to calculate their exact net gamma. Without proprietary knowledge, their net gamma can only be estimated by making positioning assumptions.
One commonly made assumption is that market makers are short 100% of put open interest and long 100% of call open interest. It is justified by the observation that traders tend to buy puts as a hedge against market downturns, and sell calls as a source of additional profit.
Using this assumption, the need for market maker positioning is replaced by a need for open interest data, which, fortunately, is readily available through any of the common brokers. Deriving individual gammas, however, will take more effort.
The Black-Scholes option pricing model describes an option’s gamma as a function of 5 parameters: risk-free rate, strike, days to expiry, implied volatility (IV), and underlying price. Though these can all be easily obtained through a broker, the model implementation must be done ourselves, and a gamma calculation must be performed for each option.
Having obtained the required positioning and gamma data, an estimate for net gamma can finally be derived by multiplying each option’s calculated gamma by its open interest, then adding the products together.
GEX Curve
Of the Black-Scholes parameters, three are option specific: strike, days to expiry, and IV. The other two, risk-free rate and underlying price, are not option specific, and should be kept constant per net gamma calculation. Therefore, net gamma is a function of only these two parameters.
By varying underlying price, we can find the inflection point at which net gamma changes signs. This gamma flip price, aka gamma flip line, represents the function’s zero. Programmatically, it can be found using Newton’s method, an iterative root finding algorithm.
To visualize net gamma, let’s plot it versus underlying price. The resulting graph is called the GEX (Gamma EXposure) curve:
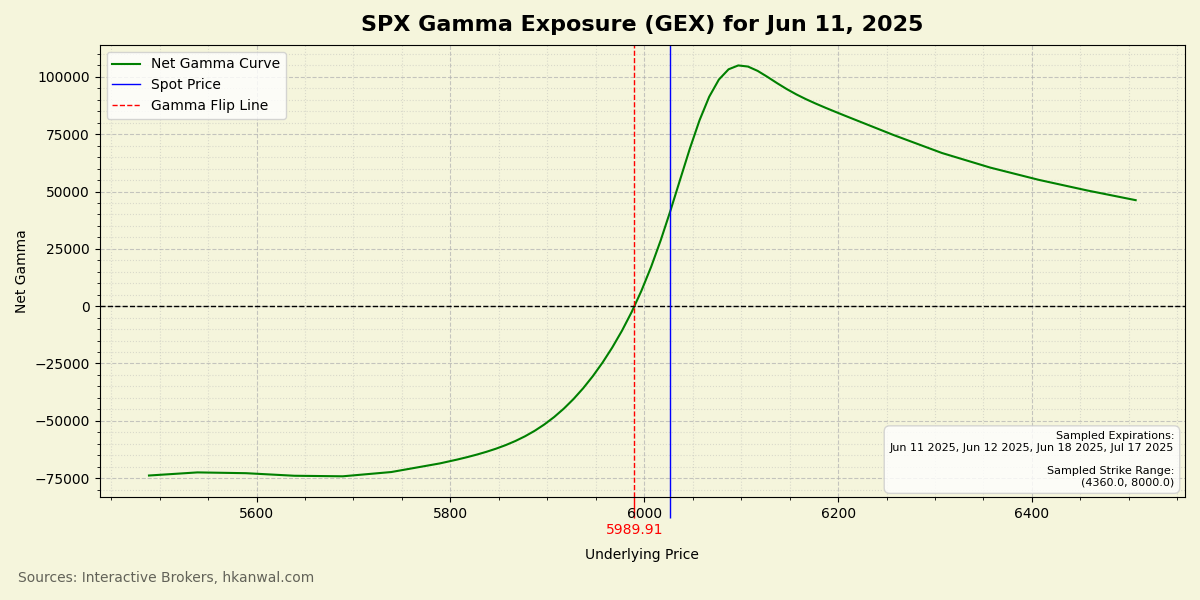
To minimize runtime, this curve was computed using a subset of all SPX options, constrained by expiration and strike range.
Note: SpotGamma provides a GEX curve that, at the expensive of the flip line being difficult to discern, is free and can be viewed at any time here: https://spotgamma.com/free-tools/spx-gamma-exposure/
What is SPX? SPX is an index that tracks the performance of the top 500 US stocks by market capitalization. It’s used as the underlying instrument here because it provides overall market insight, has extremely liquid options, and ensures our Black-Scholes model, which assumes European style contracts, is accurate.
Now that the gamma flip line has been obtained, let’s discuss its uses.
Significance For Traders
Traders that pay attention to the gamma flip line have an edge over traders that don’t. To understand why, let’s compare the practical differences between trading in positive versus negative net gamma markets.
Above the gamma flip line, low volatility causes the market to exhibit the following characteristics: price action that is mean-reverting and range-bound, directional changes that are gradual, and pinning effects that are strong near levels with high open interest. Trading strategies that rely on consistent setups and trends—such as swing trading strategies—are more likely to find success here.
Below the gamma flip line, high volatility causes the market to exhibit the following characteristics: price action that is momentum-driven and trending, directional changes that are sudden, and pinning effects that are negligible. Trading strategies that are based on momentum and have shorter time horizons—such as daytrading strategies—are more likely to find success here.
To be a successful trader, it is essential to use strategies tailored to the conditions of the market. This is why, when price drops under the gamma flip line—signalling a change in volatility regimes—successful traders consider winding down their previous positions or switching their strategy.
And what happens to naive traders that do not understand gamma exposure? Unaware of shifting market conditions, they may suddenly, and seemingly inexplicably, start experiencing losses by continuing to use a strategy that, despite previously being proftable, is no longer viable.
Additionally, all market crashes occur in negative net gamma territory, caused in part by market maker hedging activity exacerbating downward moves. Traders paying attention to the gamma flip line are forewarned of potential market crashes, and are afforded time to position themselves accordingly.
To illustrate, let’s observe the VIX (CBOE Volatility Index) with periods of negative net gamma highlighted:
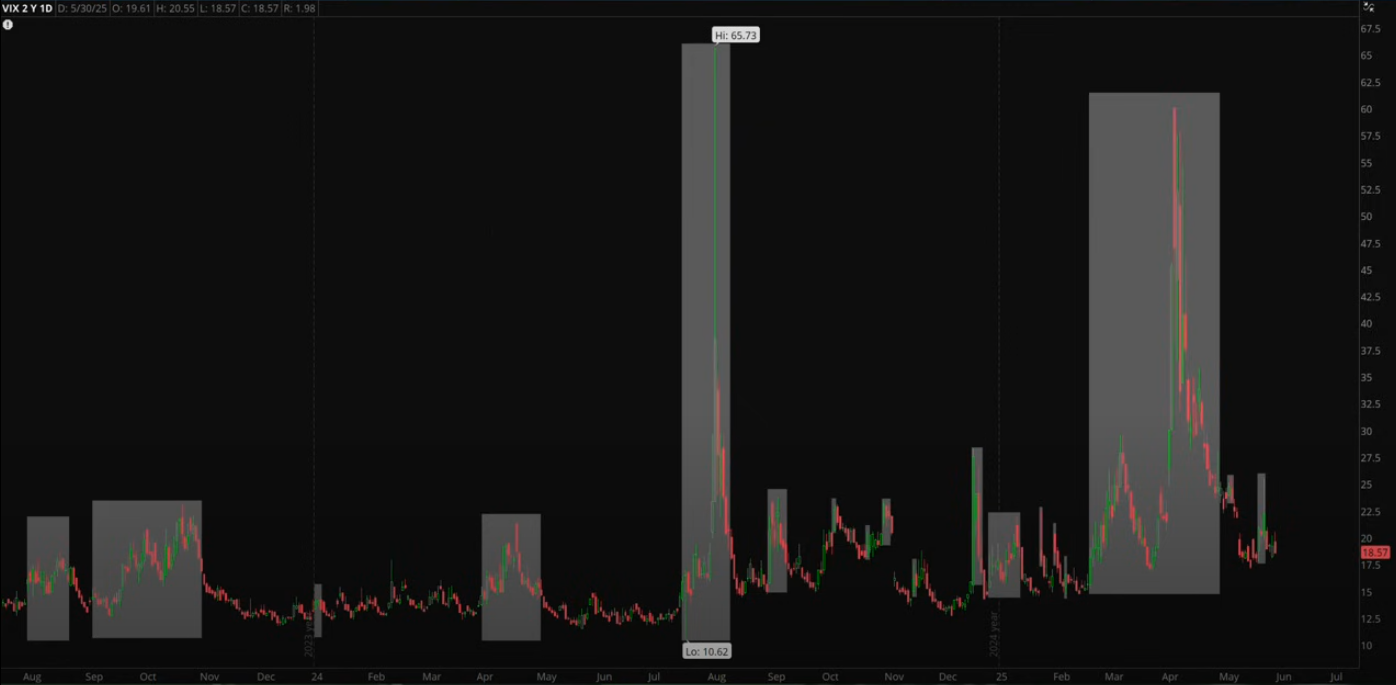
Extreme spikes in volatility correspond to market crashes. Looking at the highlighted period around the most recent crash—the tariff induced crash of April 2025—we can see that it was predicted as early as late February, almost 2 months in advance.
For these reasons, the gamma flip line is a valuable addition to any trader’s toolkit.
Next Steps
For readers that would like to generate their own GEX curve, the code is open-source and can be found here: https://github.com/hkanwal/gamma-flip-line.
To increase the accuracy of net gamma estimates, there are a couple of improvements that could be made. Firstly, better positioning estimates could be obtained using sophisticated methodologies, such as order flow analysis or skew-based heuristics. Secondly, the sample data could be increased by considering a wider range of options, though at the expense of greater data requirements and longer runtimes.
Sources
- https://www.investopedia.com/terms/l/leadingindicator.asp
- https://www.investopedia.com/terms/m/marketmaker.asp
- https://www.investopedia.com/terms/g/gamma.asp
- https://www.investopedia.com/terms/b/blackscholes.asp
- https://unusualwhales.com/news/gamma-flip-a-primer
- https://en.wikipedia.org/wiki/Newton’s_method
- https://spotgamma.com/free-tools/spx-gamma-exposure/
- https://en.wikipedia.org/wiki/S&P_500
- https://www.youtube.com/watch?v=NJvFZk1aO1U&t=2032s
- https://www.investopedia.com/ask/answers/021015/what-cboe-volatility-index-vix.asp