
Relative Strength Index (RSI)
RSI is one of the most essential indicators used in technical analysis. It visualizes the momentum of a financial instrument’s price movements and provides insight into the strength or weakness of price trends. In order to know how to utilize RSI effectively, this article is designed as a comprehensive reference.
Calculation
Since RSI is derived from closing prices (typically on the daily timeframe), the collection of historical closing prices is a prerequisite for its calculation.
First, calculate the changes between all historical closing prices—all values for t in the below formula:

Then, using the calculated changes, calculate the RMA (Relative Moving Average) for historical gains (changes that were positive) and historical losses (changes that were negative):


Above, alpha (α) is the smoothing factor. It should be set to 1 / 14 for the standard 14-period RSI.
Next, calculate RS (Relative Strength), which is an unbounded momentum indicator:

Finally, calculate RSI by normalizing RS to create a bounded momentum oscillator:

Zones
As an oscillator, RSI is bound within a defined range of 0 to 100. Here are the zones of this range and what they mean.
An RSI greater than 50 means that bullish momentum is greater than bearish momentum because it corresponds to an RS, or ratio between bullish to bearish momentum, that is greater than 1. And for an RSI less than 50, the opposite is true.
RSI values between 40 to 60 are considered to be in the neutral zone because bullish and bearish momentum are roughly equal here. Neutral values indicate a lack of substantial momentum in either direction—a lack of either a strong bullish or bearish trend.
RSI values close to 100 represent strong bullish momentum and weak bearish momentum, while RSI values close to 0 represent strong bearish momentum and weak bullish momentum.
In particular, RSI values over 70 or under 30 are considered indicators of overbought or oversold conditions. This is because such strong momentum can suggest an imminent correction as price has moved too far too fast. As such, an RSI over 70 can serve as a sell signal, and an RSI under 30 can serve as a buy signal (see below).

Note: When the overall trend is consistently strongly bullish, some consider RSI dipping below 50 as enough to serve as an oversold signal, and when the overall trend is consistently strongly bearish, some consider RSI rising over 50 as enough to serve as an overbought signal.
Exceptions
Overbought and oversold signals are not foolproof. Overbought conditions can remain overbought for a while, and oversold conditions can remain oversold for a while—especially in cases where strong momentum catalyzes further momentum.
As an example, equities with high short interest can experience a “short squeeze” when bullish momentum produces further buying pressure by virtue of short sellers needing to cover their positions.
As another example, equities with high retail option volumes (particularly, high OTM long call open interests) can experience a “gamma squeeze” when bullish momentum produces further buying pressure by virtue of market makers needing to hedge their negative gamma, and increasingly negative delta, short call positions.
Sometimes, both a short squeeze and gamma squeeze can occur simultaneously, in which case price can rocket upwards and an RSI greater than 70 can actually serve as a buy signal (see below). This was the mechanism for the GameStop ($GME) squeeze of 2021.
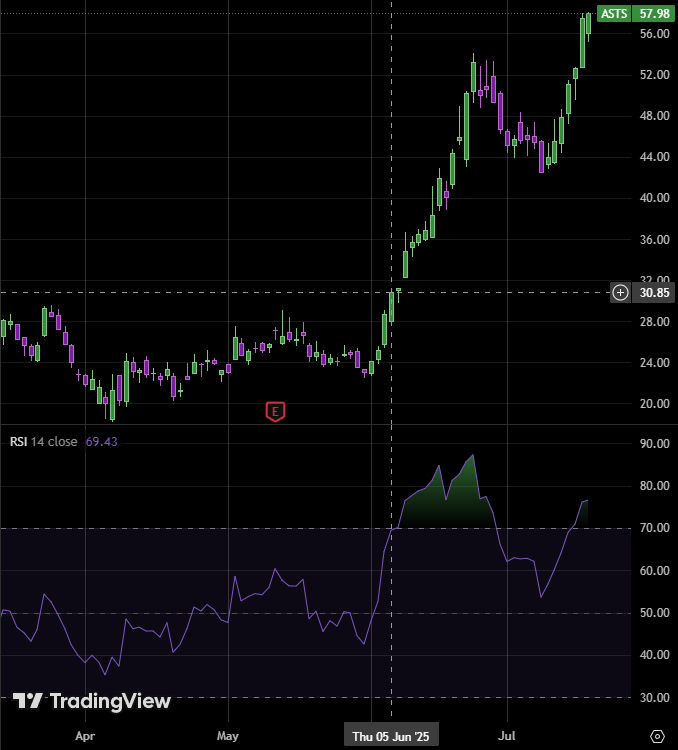 Short Squeeze + Gamma Squeeze
Contraction And Expansion
A fundamental principal of technical analysis is that price action cycles between periods of volatility contraction and expansion. Periods of contraction, aka consolidation periods, coincide with common chart patterns (such as flags, wedges, and triangles) that illustrate this tightening, or “coiling”, of price action:
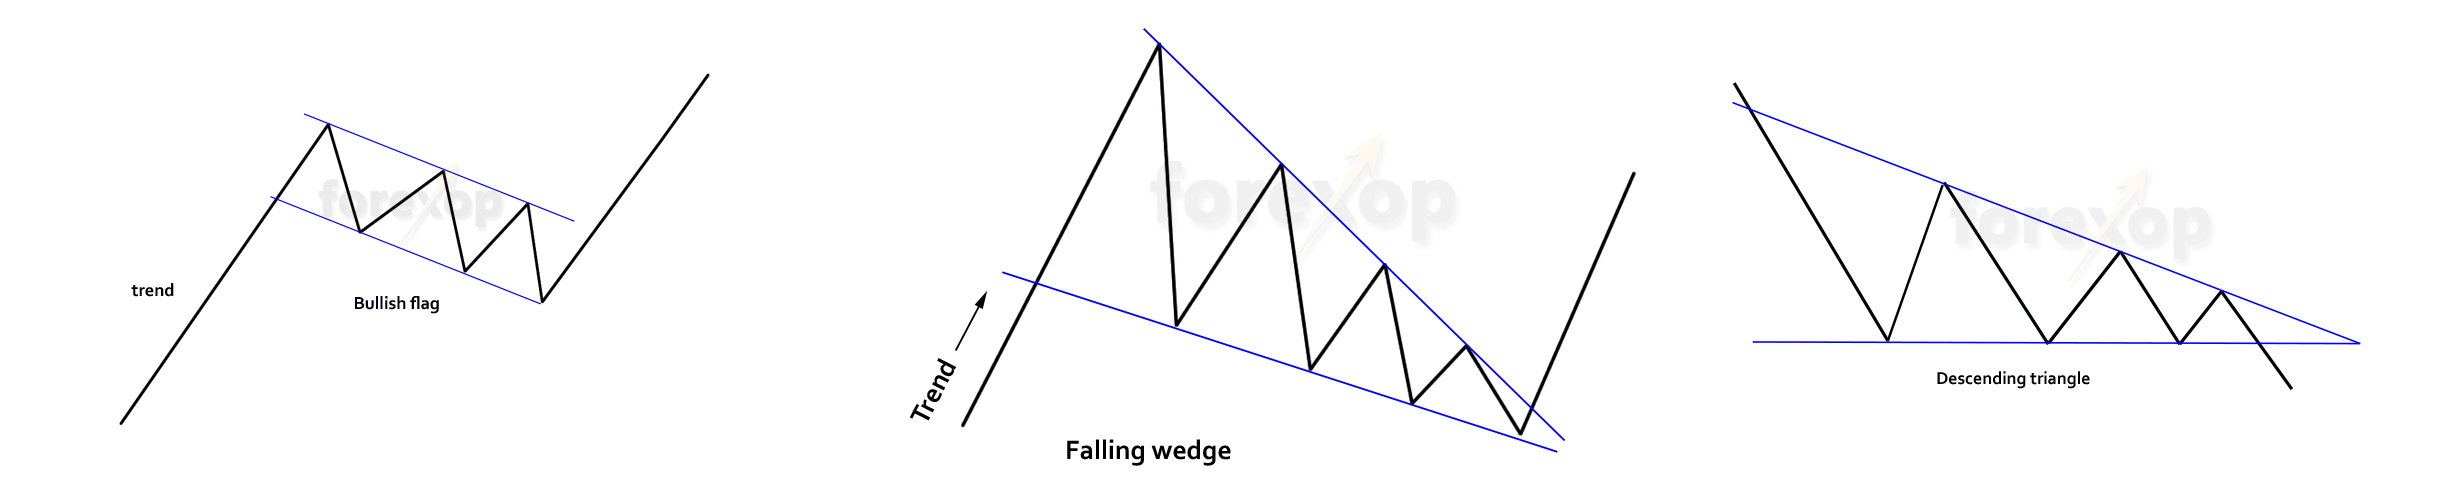
Subsequent to contraction, expansion occurs. Price breaks out to either the upside or the downside, with the magnitude of the breakout tending to correlate with the width of the base (the duration of the consolidation period).
In swing trading, such patterns offer defined risk. Losses can be minimized by placing a stop loss at, or slightly under, the support line to faciliate an early exit as soon as a bearish breakout occurs. Furthermore, these patterns can be biased to the upside if observed in conjunction with other bullish indicators.
Note: One such bullish indicator is volume drying up during consolidation within a bullish trend. It indicates strong conviction from holders and a lack of sellers.
For these reasons, swing traders screen for contracting names when searching for favorable opportunities. This can be accomplished using RSI conditions.
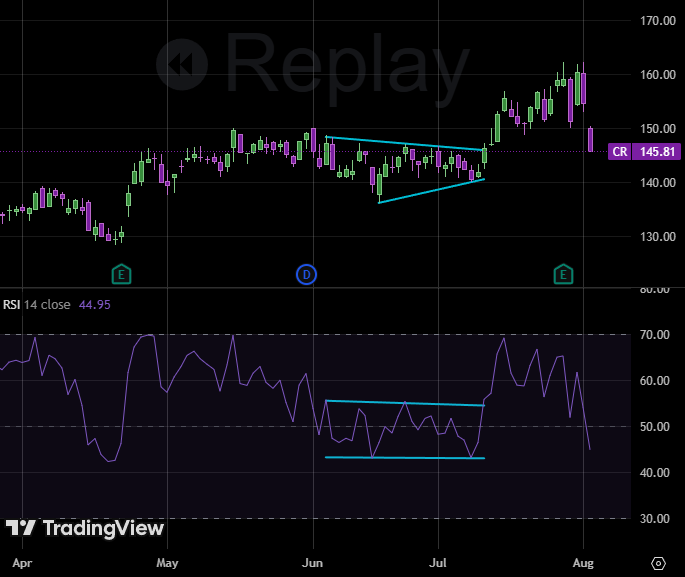
When the peaks and troughs of RSI align to form a horizontal or tightening band, it means changes in momentum have stabillized and volatility is contracting. For example, here is an RSI band coinciding with a period of consolidation, evidenced by a wedge pattern in price:
 Bullish Expansion From Contraction In Neutral Zone
Following contraction, price then proceeded to break out to the upside as volatility expanded.
Contraction can occur in the neutral zone (when there is no trend, as depicted above), or it can occur when price action is trending:
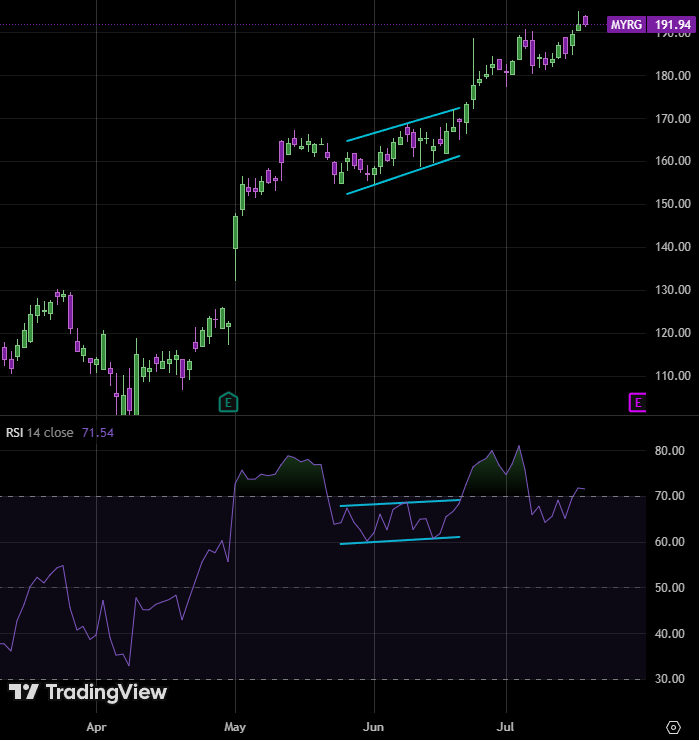 Bullish Expansion From Contraction In Bullish Trend
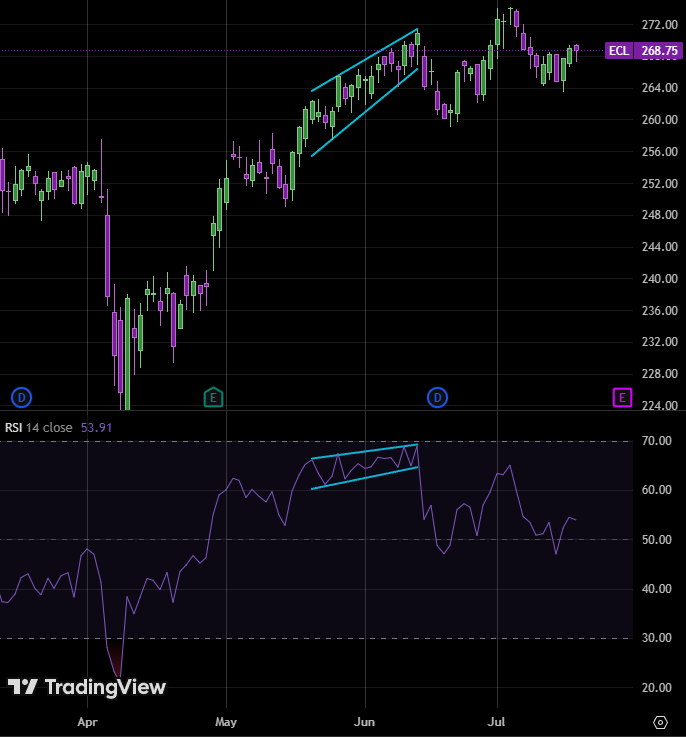 Bearish Expansion From Contraction In Bullish Trend
To program the identification of horizontal RSI movement into market scanners, a condition of flattened SMA (Simple Moving Average) of RSI can be used:

In this way, contracting names can be easily found in a way that is trend agnostic.
Note: I wrote an open-source screener in Python that uses RSI conditions to identify contracting stocks. It may be of interest to readers that also use Interactive Brokers: https://github.com/HKanwal/rsi-contraction-screener
Divergences
During a bullish trend, price experiences a series of higher highs. During a bearish trend, price experiences a series of lower lows. Correspondingly, RSI also experiences a series of higher highs or lower lows. If two trendlines are drawn—one connecting the highs or lows of price, and the other of RSI—and their slopes are of different sign, this is called a divergence.
Divergences are useful to know because they can signal trend reversal.
A bullish divergence occurs when price makes a lower low, but RSI makes a higher low (see below). This indicates waning downward momentum and a potential trend reversal to the upside.
 Bullish Divergence Signalling To Buy
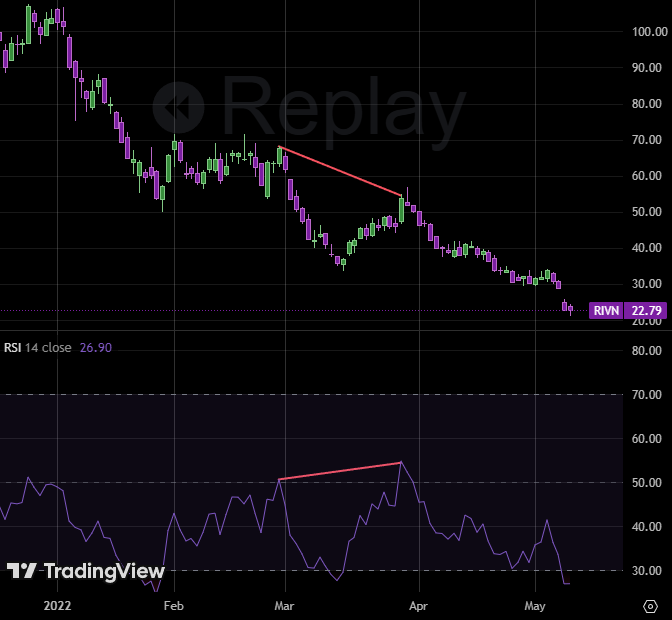
A bearish divergence occurs when price makes a higher high, but RSI makes a lower high (see below). This indicates waning upward momentum and a potential trend reversal to the downside.
 Bearish Divergence Signaling To Sell
Divergences tend to be more reliable signals when RSI is nearer to 0 or 100, and tend to be less reliable when RSI is closer to the neutral zone.
Furthermore, greater slope differences are considered stronger divergences—and, therefore, stronger signals—because they indicate a more pronounced disagreement between price action and momentum.
Hidden Divergences
During a bullish trend, price often experiences pullbacks before continuing higher; these pullbacks create a series of higher lows. During a bearish trend, price often experiences rallies before continuing lower; these rallies create a series of lower highs. Correspondingly, RSI also experiences a series of higher lows or lower highs. If two trendlines are drawn—one connecting the pullbacks or rallies of price, and the other of RSI—and their slopes are of different sign, this is called a hidden divergence.
Hidden divergences are useful to know because they can signal trend continuation.
A bullish hidden divergence occurs when price makes a higher low, but RSI makes a lower low (see below, in green). This indicates buyers are defending a higher price despite waning bullish momentum. It means there is still high demand and signals bullish trend continuation.
 Bullish Hidden Divergence Signalling To Buy
A bearish hidden divergence occurs when price makes a lower high, but RSI makes a higher high (see below). This indicates sellers are stepping in at a lower price despite waning bearish momentum. It means there is still high supply and signals bearish trend continuation.
 Bearish Hidden Divergence Signalling To Sell
Hidden divergences tend to be more reliable signals when RSI is closer to the neutral zone, and tend to be less reliable when RSI is nearer to 0 or 100.
Similar to normal divergences, greater slope differences are considered stronger hidden divergences—and, therefore, stronger signals.
Conclusion
RSI is a versatile momentum indicator. It can be used to identify overbought and oversold conditions, screen for contracting names, and predict trend reversals or continuations. For these reasons, it is an invaluable addition to any trader’s toolkit.