
Saylor-Schiff Indicator
This article details a Bitcoin indicator that compares the performance of Bitcoin relative to Gold, humorously dubbed the Saylor-Schiff indicator. Don’t let the name fool you though — it has a solid track record and can be useful for timing trades.
Background
On the risk spectrum, Bitcoin and Gold occupy opposite extremes. At one end, Bitcoin is considered high risk due to its high volatility and speculative nature. At the other end, Gold is considered low risk due to its low volatility and safe-haven nature. By comparing the relative performance of these two seemingly contradictory asset classes, a valuable indicator can be developed — one that serves as a barometer for whether the market is in a risk-on or risk-off regime.
The rationale is simple. When Bitcoin is outperforming Gold, it indicates that the market is in a risk-on regime because investors are flocking to the riskier asset. Conversely, when Gold is outperforming Bitcoin, it indicates that the market is in a risk-off regime because investors are reaching for safety.
Why is this useful to know? Because it can help dictate when to allocate offensively and when to allocate defensively. Risk-on regimes tend to be the best times to hold riskier positions, such as Bitcoin and high beta equities. In risk-off regimes on the other hand, it may be prudent to minimize risk because these periods are when the largest drawdowns can occur.
Indicator Construction & Interpretation
Given it’s potential insightfulness, let’s learn how to construct such an indicator in a two-step process that should be easy to implement in any modern charting software.
First, take the ratio between Bitcoin and Gold on the weekly timeframe (where one candle represents one week). Then, calculate the 4-week rate of change (ROC) of this ratio. Here is the result plotted under the price of Bitcoin:
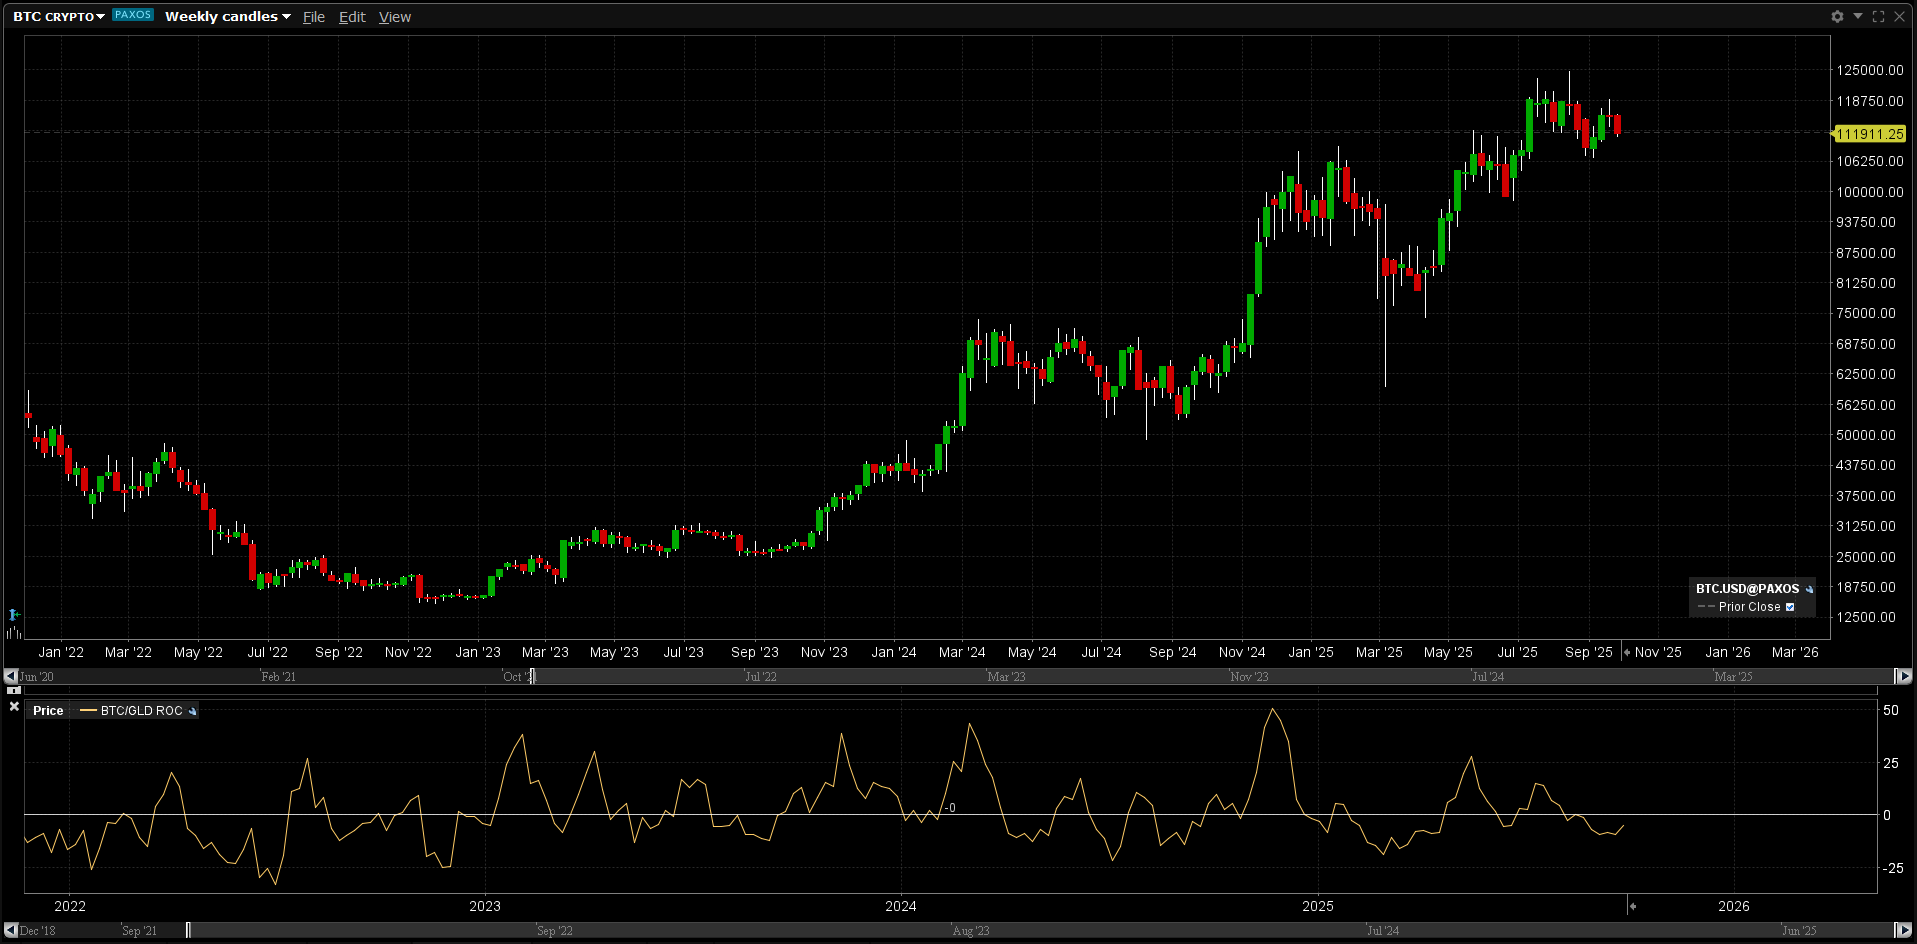 Saylor-Schiff indicator
Upon visual inspection, it can be noticed that periods where the ROC is above 0 tend to coincide with significant upwards price movements, whereas periods where the ROC is below 0 tend to coincide with consolidations and/or pullbacks in price.
This makes sense because positive ROC readings correspond to periods where Bitcoin was outperforming Gold (the Bitcoin-to-Gold ratio was increasing), whereas negative readings correspond to periods where Gold was outperforming Bitcoin (the Bitcoin-to-Gold ratio was decreasing).
Notably, the indicator crossing up through 0 tends to precede rises in price.
Strategy
Based on its relationship to the price of Bitcoin, the above constructed Saylor-Schiff indicator can be used to develop a deterministic Bitcoin trading strategy. The rules for buying and selling are as follows.
A buy signal occurs when the ROC crosses up through 0. When this happens, a buy stop order is placed above that weekly candle high. If the following weekly candle prints a lower high without the ROC crossing back down through 0, the stop price is updated to the high of the new weekly candle. If a position is not entered by the time the ROC crosses back down through 0, the buy signal is invalidated and the order is cancelled. If price does reach the entry point and the order is filled, a sell signal is awaited.
A sell signal occurs when the ROC crosses down through 0. When this happens, a sell stop order is placed below that weekly candle low. If price does not hit this stop loss and the next weekly candle prints a higher low, the stop price is updated to the low of the new weekly candle. Any buy signal received during this time is invalid because a position is already being held. If price hits the stop loss and the order is filled, a new buy signal is awaited.
Backtesting
Given its deterministic nature, it is straightforward to develop backtests for the strategy described above.
First, here is a visualization of when buy and sell orders would have been filled according to the strategy’s rules over the past six years (log scale):

Highlighted using red arrows are major drawdowns, including multiple -50% corrections, that the Saylor-Schiff strategy avoided. Despite selective exposure, the strategy still delivered a return of 873.78% compared to a buy-and-hold return of 1251.29% over the same period. This suggests that using the Saylor-Schiff indicator limits risk at the cost of some alpha.
While Bitcoin bulls are likely to find this strategy inferior to buying and holding for the long term, the limited risk may be appealing to traders that are skeptical of Bitcoin but still want to participate in its shorter-term rallies, or for traders that feel unable to weather the worst of Bitcoin’s volatility.
To illustrate the reduced volatility of the Saylor-Schiff strategy, here is its performance over the last four years compared to that of buying and holding Bitcoin if both started with $10,000:
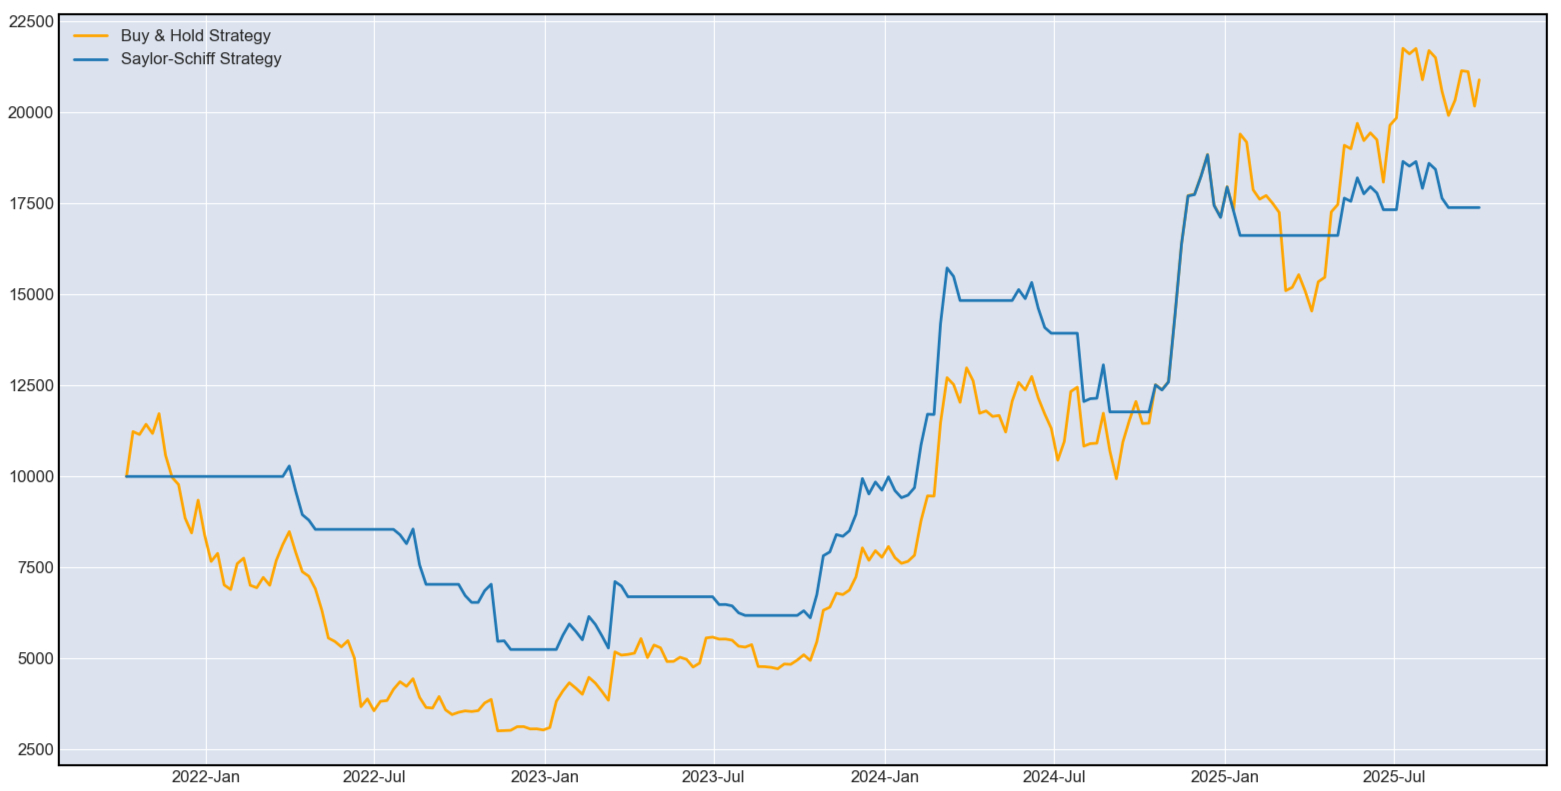
It can be observed that the Saylor-Schiff strategy suffered less drastic drawdowns during the 2022 bear market at the cost of reduced participation in later rallies.
Another notable benefit is that capital is infrequently utilized, and so incurs decreased opportunity cost as compared to buying and holding. Where the Saylor-Schiff historical performance graph flatlines, capital is out of Bitcoin and available to use for other trades. This can be preferrable for successful swing traders who are able to generate returns elsewhere while Bitcoin consolidates.
As a quantitative example, in approximately the last four years the Saylor-Schiff strategy managed to generate returns of 73.87% versus Bitcoin’s 153.05% while only holding a position 42% of the time for a total hold time of 87 out of 209 weeks.
Summary
In summary, the Saylor-Schiff indicator provides insight into market risk regimes by comparing the performance of Bitcoin (a highly speculative asset) to that Gold (a safe-haven asset). For Bitcoin traders, it can provide timely buy and sell signals that capture much of the upside while significantly limiting risk.
Though such a strategy will likely underperform buying and holding in the long run, its comparative safety and its infrequent capital utlilization rate may be appealing to some traders.